2.2. Generating economic value at a regional and local level
Post Office’s economic impact across the United Kingdom is driven primarily by its extensive branch network: for every £10 spent by Post Office, approximately £8 arises from the network (£3.8 billion in total), with the remaining impact (£0.9 billion) being generated centrally from Post Office Limited’s expenditure.
Post Office’s network of more than 11,500 branches has a strong presence in every nation, region and parliamentary constituency of the United Kingdom, which drives economic growth across the country. This near-universal geographical footprint is considerably wider than most other businesses, as Post Office serves all communities across the country. This is guaranteed and safeguarded through Post Office’s access criteria, where (amongst other criteria) 99% of the United Kingdom’s population must be within three miles of a post office (Clark and Booth, 2022). This geographic footprint translates into an unparalleled economic impact distribution, which helps support Postmasters, host retailers and local businesses across the entire country.
Post Office’s network of more than 11,500 branches has a strong presence in every nation, region and parliamentary constituency of the United Kingdom, which drives economic growth across the country.
This near-universal geographical footprint is considerably wider than most other businesses, as Post Office serves all communities across the country. This is guaranteed and safeguarded through Post Office’s access criteria, where (amongst other criteria) 99% of the United Kingdom’s population must be within three miles of a post office (Clark and Booth, 2022). This geographic footprint translates into an unparalleled economic impact distribution, which helps support Postmasters, host retailers and local businesses across the entire country.
Regional impact
Post Office drives economic value across each and every region of the United Kingdom, and the first map (presented in Figure 1) illustrates this broad economic impact that Post Office’s branch network has across the United Kingdom. Considering aggregate figures, the branch network contributed an average of £317 million in each region, with at least £250 million of economic impact in eight of the United Kingdom’s 12 regions and at least £100 million of economic impact in every region. As the Government seeks to level up the United Kingdom and tackle regional disparities, the wide-ranging impact of Post Office highlights how its branches are already supporting high streets and local businesses in each and every part of the United Kingdom.
Expressed differently, Post Office’s branch network generated an economic impact in 2021-22 across the United Kingdom equivalent to between £46 and £69 per person in every region and home nation of the United Kingdom (with an average of £57 per person
nationwide). Taking into account the size of each region, these results demonstrate the evenly distributed impact that Post Office has across the country and a more extensive footprint across the United Kingdom than almost any other business.
Local impact
Post Office also generates substantial economic impact at local, as well as regional, level. The breadth of this impact is shown by the fact that there were on average 18 branches per parliamentary constituency, with at least 10 branches that were open and active in 561 parliamentary constituencies and at least five active, open branches in every parliamentary constituency of the United Kingdom in March 2022.
The breadth of Post Office’s impact is shown in Figure 2, which shows the direct, indirect and induced impact of Post Office’s branch expenditure on the United Kingdom’s economy originating from each parliamentary constituency.⁹ The expenditure of Post Office’s branches resulted in an average economic impact on the UK economy of £5.8 million per parliamentary constituency, which is equivalent to an economic contribution of £57 per person on average. Digging deeper, there were 102 constituencies (out of 650) associated with at least £7.5 million of UK-wide economic impact and 426 constituencies associated with an impact of at least £5 million. To demonstrate the breadth of the impact, the analysis shows that at least £2 million of economic impact originated from every parliamentary constituency.
Post Office has a particularly strong per capita impact originating from rural constituencies in Scotland (such as Ross, Skye and Lochaber, and Argyll and Bute) and the North West (such as Westmorland and Lonsdale, and Penrith and The Border).
Figure 1
Direct, indirect and induced impact of Post Office branch expenditure in each region of the United Kingdom, per person and overall, 2021-22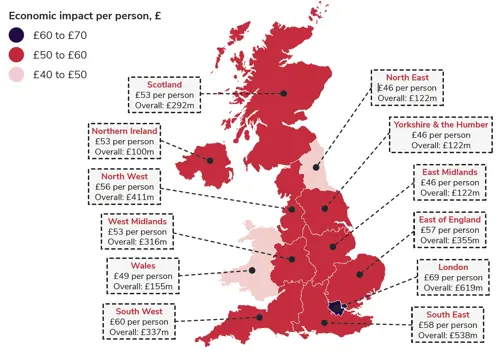
Note: Total economic impact figures were divided by mid-2020 population estimates for United Kingdom regions (Office for National Statistics, 2021b) to obtain per person figures. The shading refers to the economic impact per person that takes place in that region. For example, the economic impact in the North West considers the impact of branches in every region (including the North West) on the North West’s economic activity.
Source: London Economics’ analysis based on Post Office data and Office for National Statistics (2021b). Contains National Statistics data, OS data, Royal Mail, Gridlink, LPS (Northern Ireland), ONS, NISRA data, NRS data and Ordnance Survey data © Crown copyright and database right 2022.
⁹ In other words, this represents the benefit that branches in each constituency bring to the whole of the United Kingdom’s economy. While a significant proportion of that impact will be in the constituency itself, a large proportion will spill over into other areas of the country through the ripple effect of the expenditure.
Figure 2
Direct, indirect and induced impact of Post Office branch expenditure per person originating in each United Kingdom parliamentary constituency
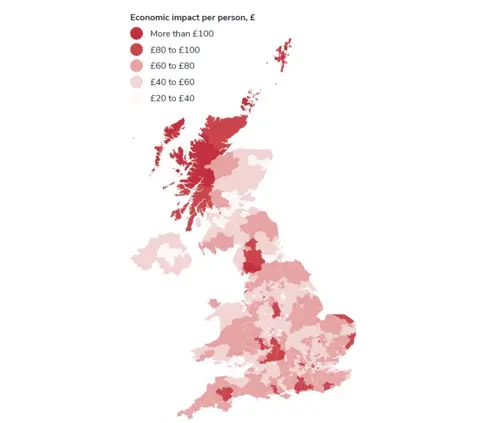
Note: Total economic impact figures were divided by mid-2020 population estimates for United Kingdom regions (Office for National Statistics, 2021b) to obtain per person figures. The map refers to direct, indirect and induced expenditure for which the direct expenditure originates in that constituency. For example, the shading in Chesterfield would consider the direct, indirect and induced effect of expenditure by branches in Chesterfield on the rest of the United Kingdom, rather than the impact of branches across the United Kingdom on Chesterfield.
Source: London Economics’ analysis based on Post Office data and Office for National Statistics (2021b). Contains National Statistics data, OS data, Royal Mail, Gridlink, LPS (Northern Ireland), ONS, NISRA data, NRS data and Ordnance Survey data © Crown copyright and database right 2022.